Latest news Periodic table shows difficulty of picking winners
Predicting returns over a single year is always fraught, as demonstrated by Mercer’s periodic table of investment returns. Produced each year, the table colour codes 16 major asset classes and ranks how each performed on an annual basis over the last 10 years. The table illustrates the adage that past performance is not a reliable indicator of future returns. Let’s look at a couple of examples: New Zealand equities and global equities.
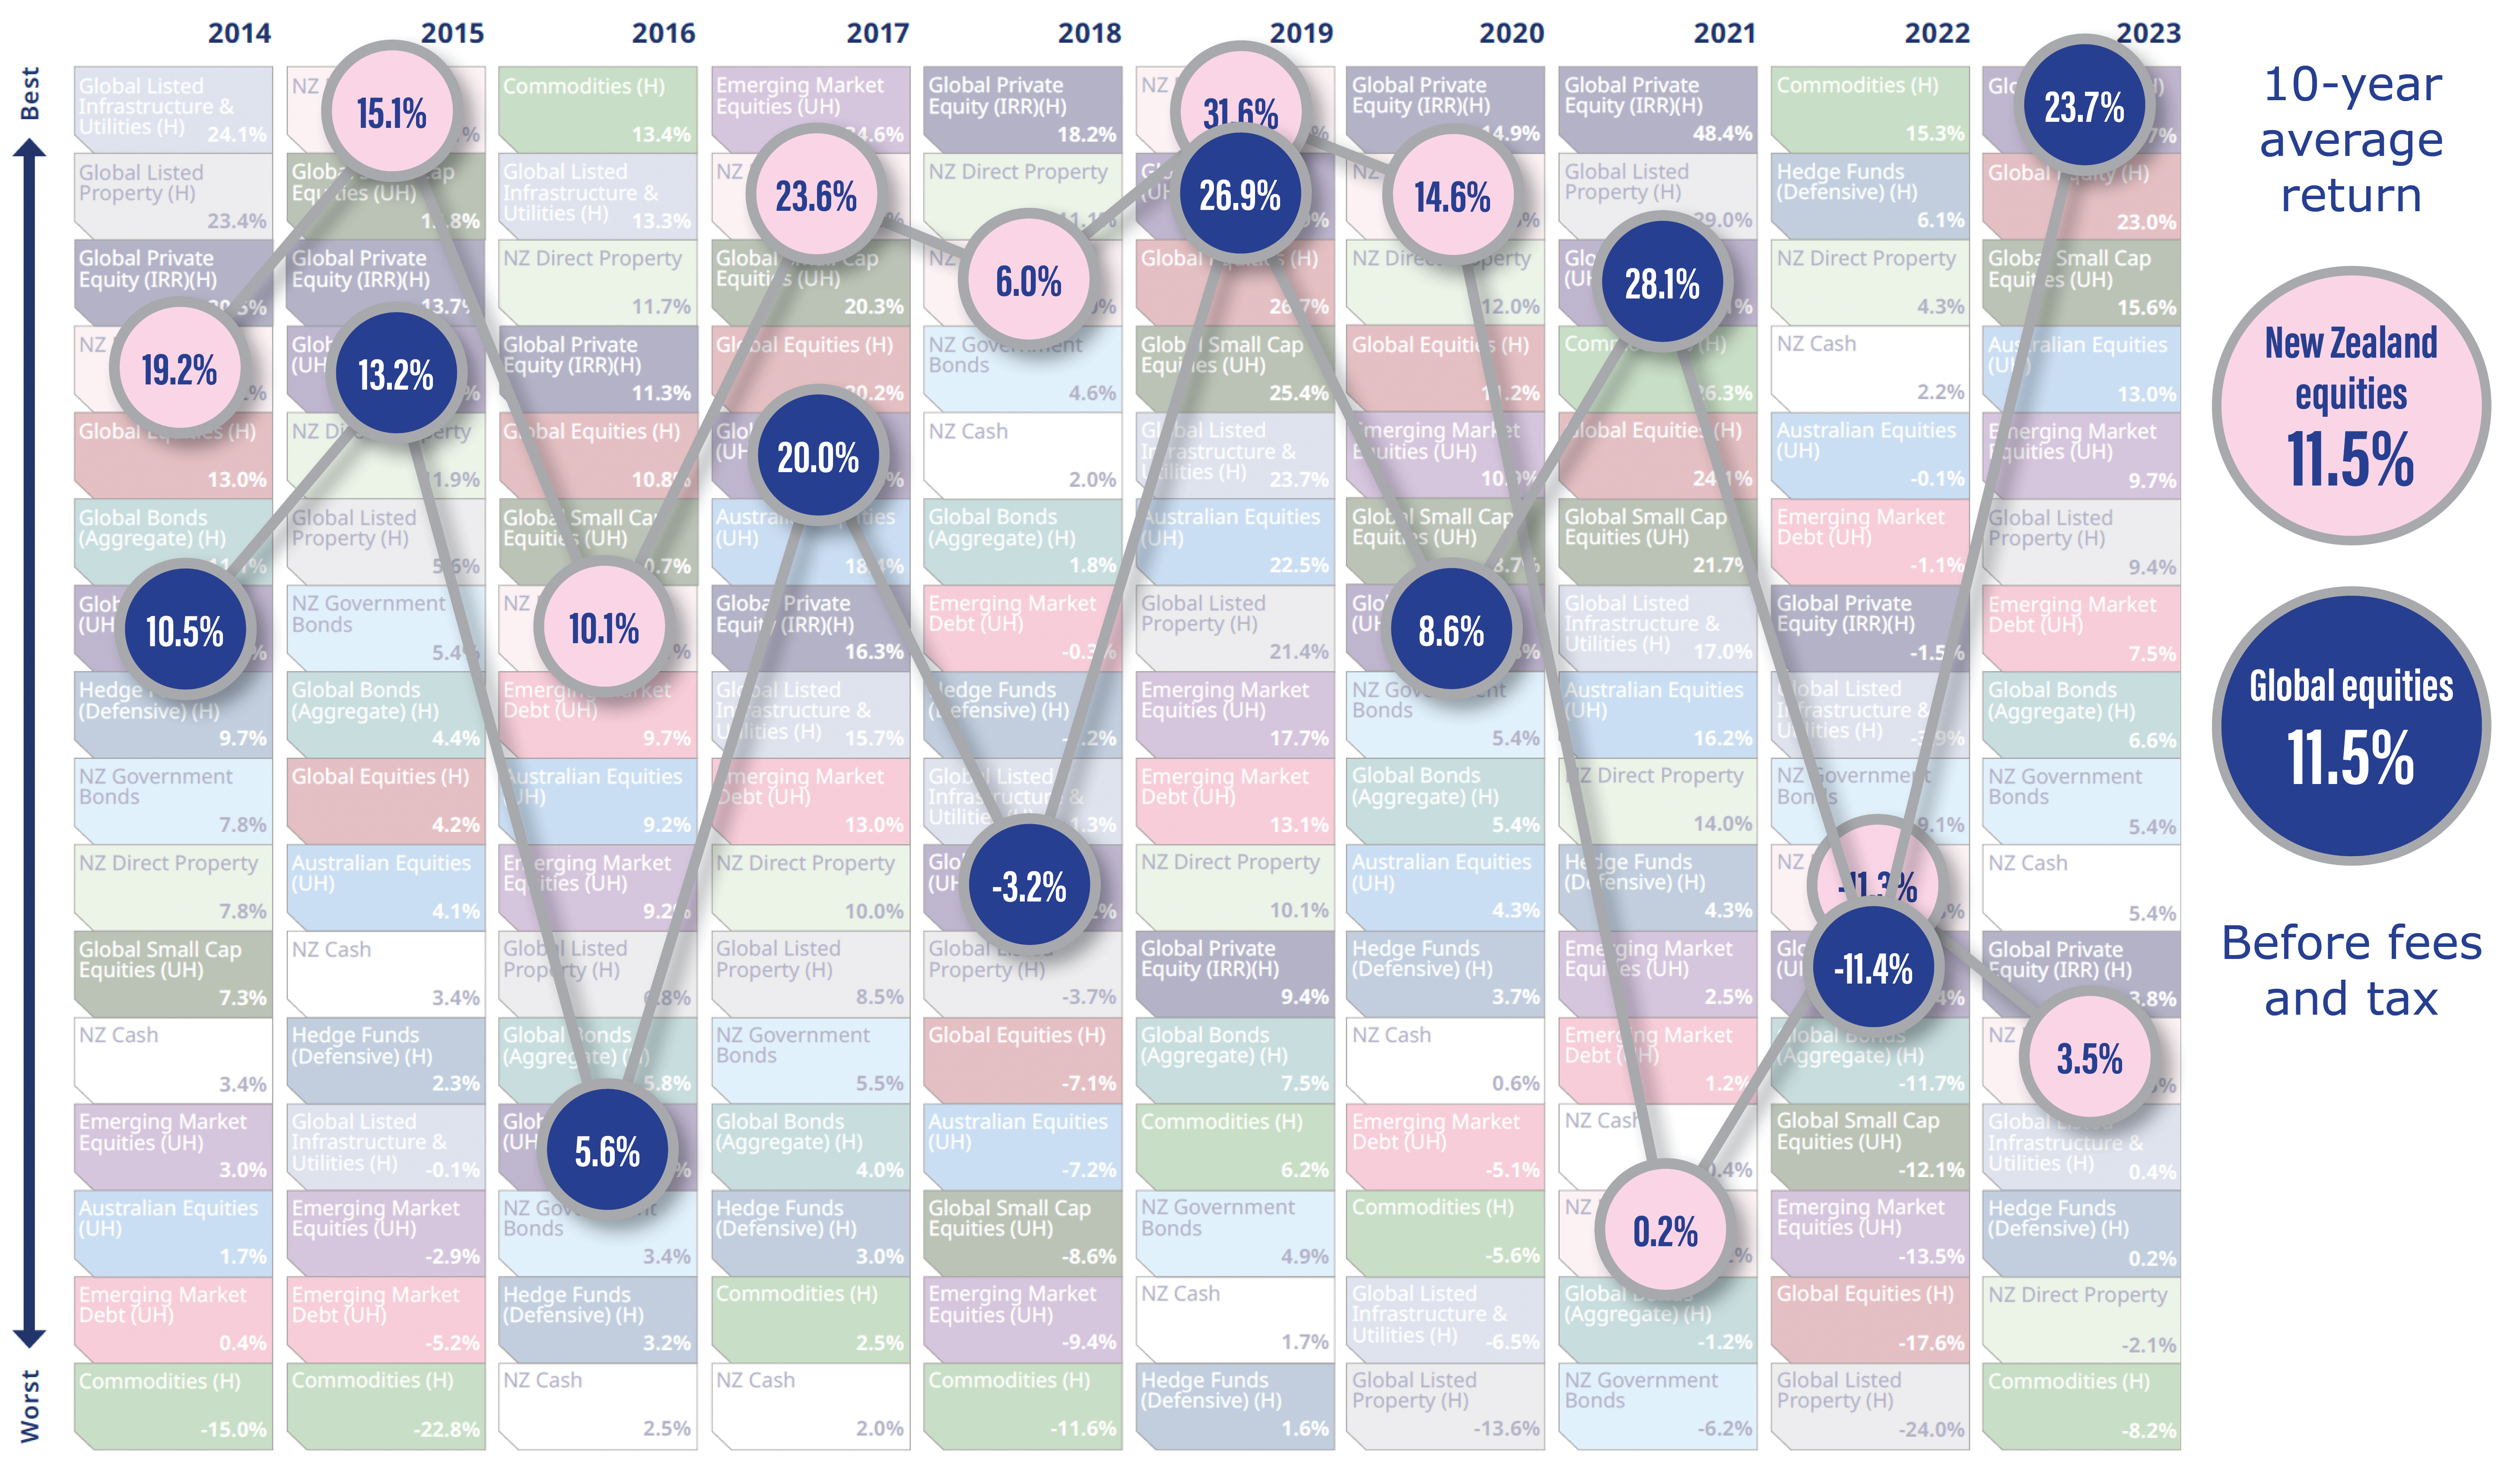
As this table shows, New Zealand equities were one of the best performers for 6 out of 7 years before tumbling down the rankings in 2021 and being well off the pace over the following 2 years. Still, it has been one of the best-performing asset classes over the decade, returning an average of 11.5% over the 10 years to 31 December 2023.
Now take a look at global equities (unhedged*). This asset class also returned an average of 11.5% per year over the decade. You’ll see its ranking relative to peers produces quite a different pattern, bouncing around from the middle of the pack to high and to low.
* Unhedged means returns include the effect of fluctuations in the value of the New Zealand dollar against overseas currencies in which investments were made.
Note that PSS doesn’t invest in all the asset classes shown in the table.
- View an interactive version of Mercer’s 2023 periodic table
- Read Mercer’s associated commentary
The advantages of diversification
One of the advantages of saving with the scheme is that your savings are spread across many different investments in a range of asset classes. Different assets perform differently in different market conditions. For instance, fixed-interest investments such as bonds might produce solid returns at a time when shares are underperforming and vice versa. By spreading your investments across different asset classes, you can reduce the volatility of your overall portfolio while maintaining your expected return. This is referred to as asset diversification. The exposure to each investment class varies depending on which investment option(s) you choose.
- Read more about your investment options
- Read more about diversification and risk
Risk and return
The asset classes listed in the periodic table above can be broadly grouped into two types: income assets and growth assets. Growth assets like equities (shares) tend to outperform income assets like fixed interest (bonds) in the long run. At the same time, returns from income assets tend to be more consistent from year to year, whereas returns from growth assets tend to be more up and down (volatile). When we talk about investment risk in this context, we mean the volatility of returns.
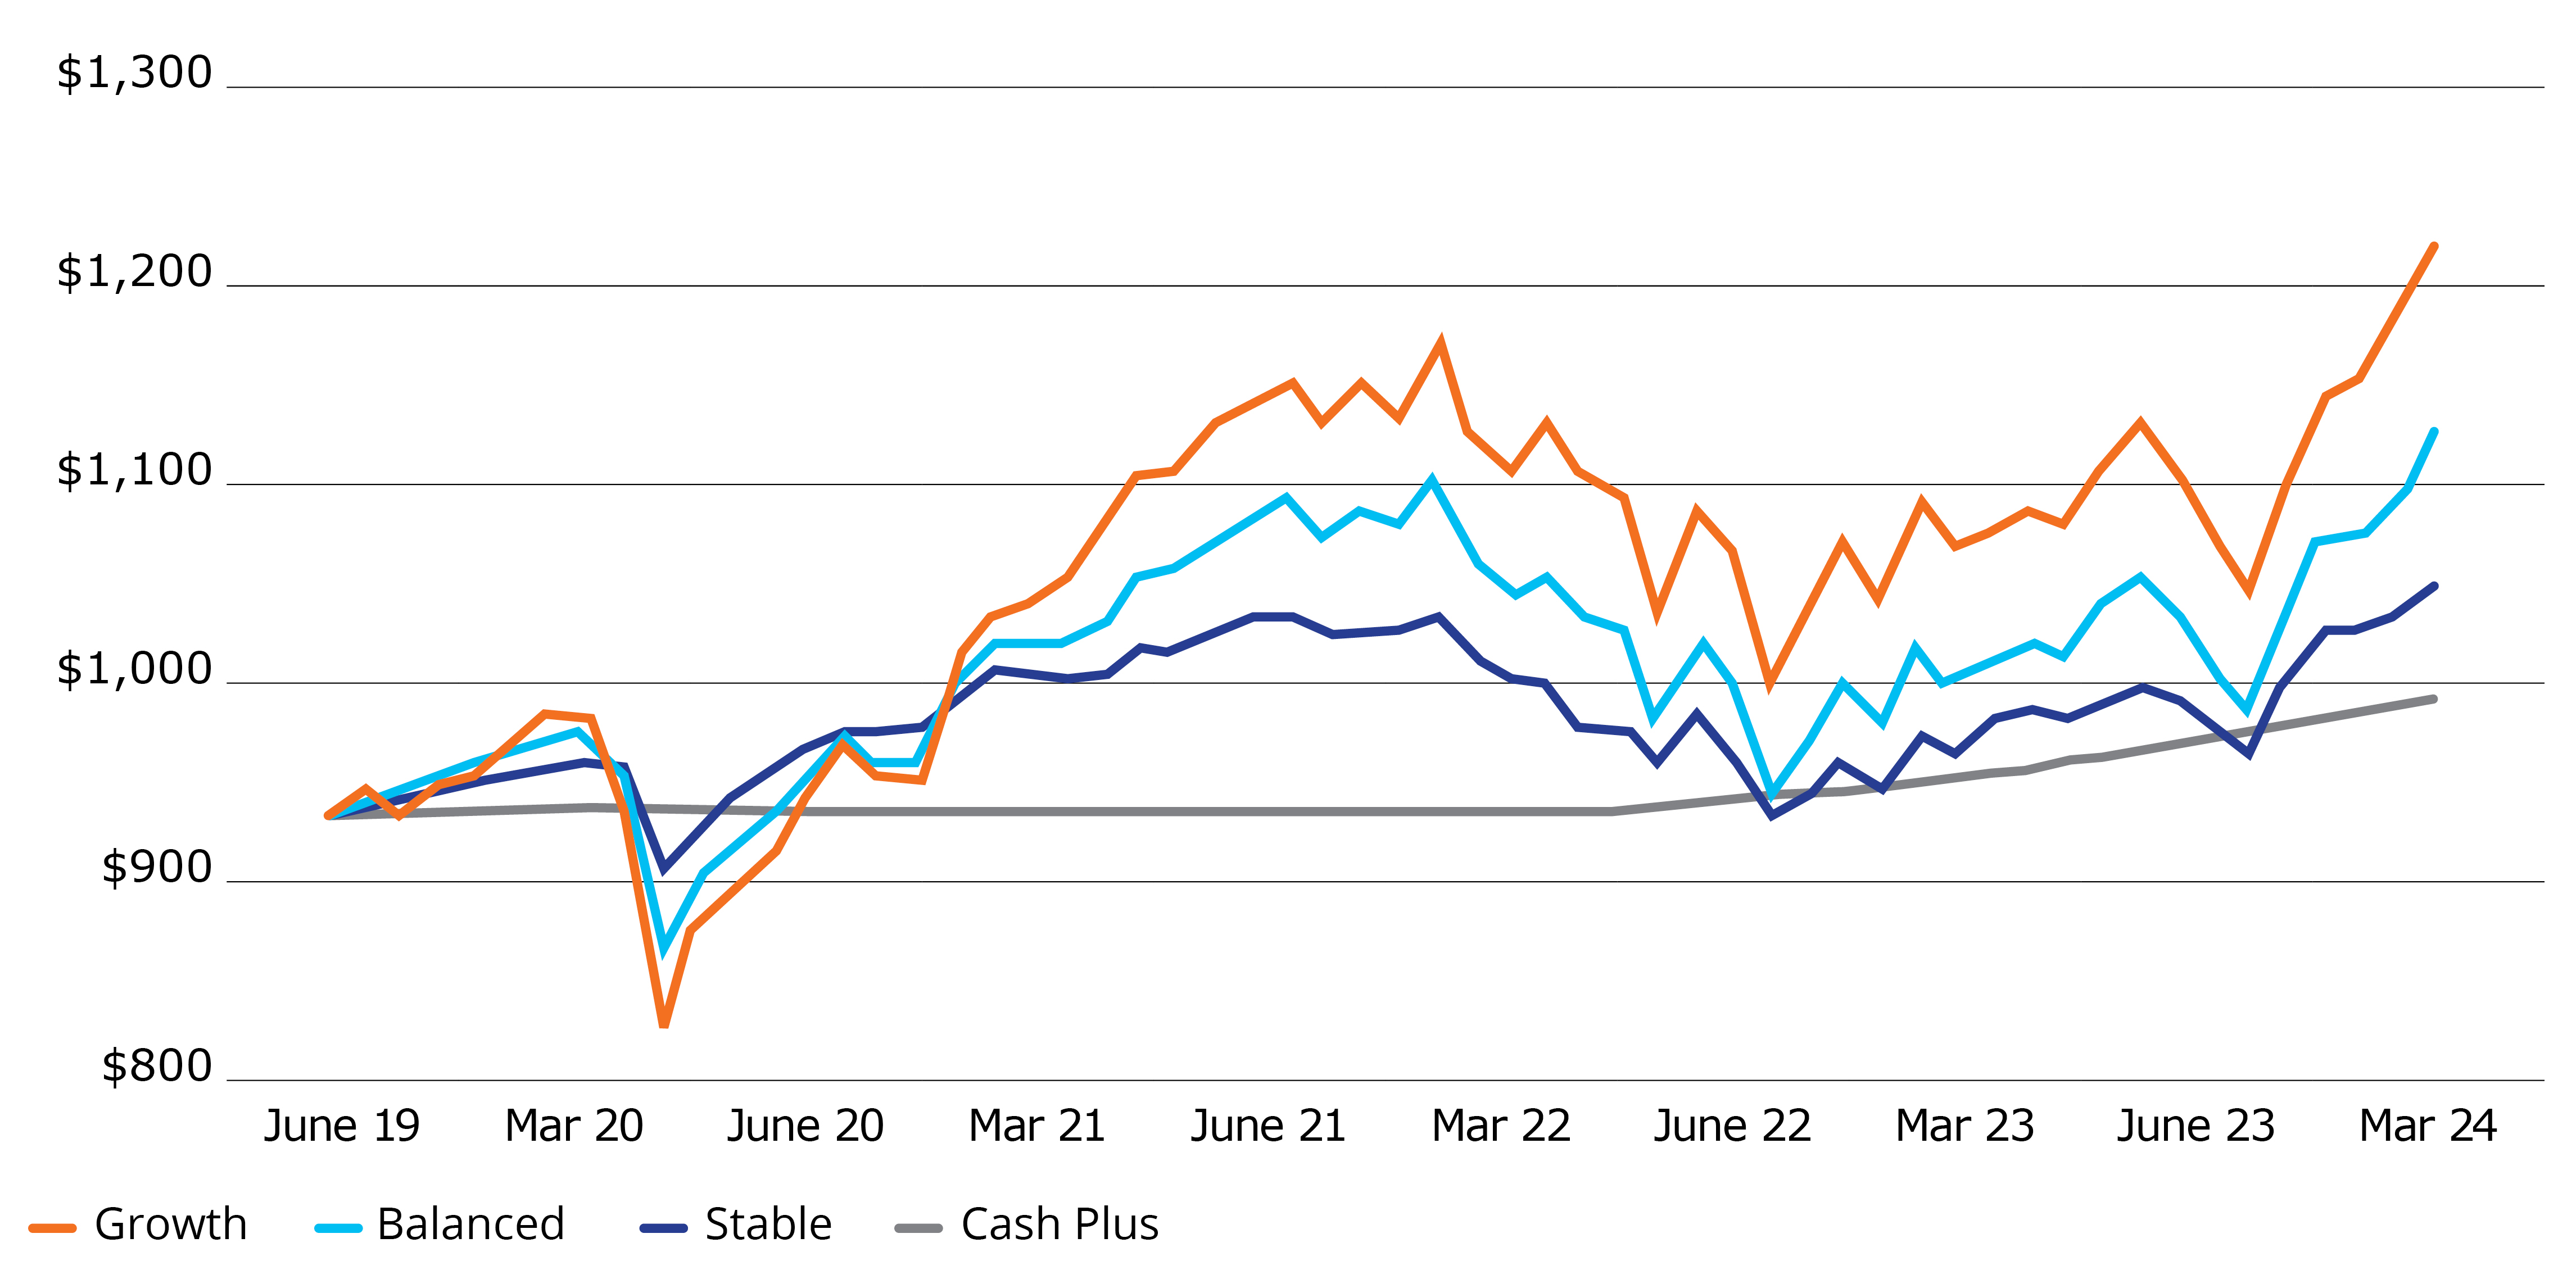
So how does this translate to your investment options? High Growth invests almost entirely in growth assets. It has the highest risk/return profile. That means it is likely to produce higher returns over time but with the most volatility along the way. You need to have time to ride out the highs and lows in order to reap the benefits. At the other end of the scale, Cash Plus invests entirely in income assets. This option is likely to produce the lowest returns but with the least volatility. It’s designed for short-term saving as there’s a good chance returns won’t keep pace with inflation. The following graph illustrates the volatility of our primary investment options. It tracks the growth of $1,000 invested on 31 March 2014 over 10 years. We haven’t included High Growth in this graph as it wasn’t introduced until 2021.
Growth from $1,000 starting on 30 June 2019
(After fees and top PIR of 28%)
Choosing the best investment option
How should you go about choosing an investment option when investment markets are so unpredictable? You need to consider factors such as when you will need to spend the money. Are you planning to buy a house in the near future? Or are you saving for the long term? Generally, the closer you are to realising your investment, the more conservative your strategy should be. Even at retirement, when you may need your savings to provide an income for 20 years or more, you may not want to have all your money invested in a low-risk investment option. Another thing to think about is how you feel about risk. This is sometimes called the sleep test. Would you lose sleep at night if your savings suddenly dropped in value by 5%, 10% or 15%? Would you hold your course? Would you be tempted to switch to a lower-risk fund instead of waiting for markets to recover?
Time to review your investment choice?
- Check your current investment strategy against our risk profiler
- Arrange a time to talk with someone from Mercer’s financial advice team