Latest returns
Your investment returns depend on the performance of the investment option(s) you have chosen to invest your savings in. Returns may be negative, nil or positive.
Daily unit pricing
Updated at the end of each trading day
The scheme uses daily unit pricing. When you sign in to your account to view your investment balances online, you see the unit price, number of units and dollar value for your holding in each investment option. A unit represents a share in a particular investment option. The unit price is based on the net value of all the investments held under that investment option. At the end of each trading day, we declare a unit price for each option, just like a share price. When your contributions are paid into the scheme, you effectively buy additional units based on that day’s unit price. Similarly, when you make a withdrawal, you redeem units to the value of your withdrawal based on that day’s unit price.
Investment management fees and expenses are reflected in the unit price. Tax is not reflected in the unit price. This is because the scheme is a Portfolio Investment Entity (PIE). A PIE is a type of investment vehicle in which investment earnings accruing to an individual investor are taxed at a rate based on the annual income of that investor. This is called your prescribed investor rate (PIR). Read more about tax.
Current prices
| After expenses but before tax | Current price 02/02/2024 |
|---|---|
| High Growth | $1.0118 |
| Growth | $1.4878 |
| Balanced | $1.3420 |
| Stable | $1.2133 |
| Cash Plus | $1.1564 |
Percentage returns for this scheme year
Updated monthly
These investment performance figures are based on the change in unit prices over a given period and are expressed as a percentage. Returns are after fees and before tax. Percentage returns on your investments will vary depending on your PIR.
High Growth % |
Growth % |
Balanced % |
Stable % |
Cash Plus % |
|
|
April 2023 |
1.30 |
1.20 |
0.94 |
0.46 |
0.41 |
|
May 2023 |
-0.39 |
-0.88 |
-0.65 |
-0.17 |
0.46 |
|
June 2023 |
3.56 |
2.75 |
2.08 |
0.75 |
0.44 |
|
July 2023 |
2.02 |
1.80 |
1.39 |
0.59 |
0.49 |
|
August 2023 |
-2.04 |
-2.09 |
-1.59 |
-0.49 |
0.49 |
|
September 2023 |
-3.20 |
-3.15 |
-2.76 |
-1.62 |
0.42 |
|
October 2023 |
-2.63 |
-2.28 |
-1.84 |
-0.80 |
0.51 |
|
November 2023 |
5.35 |
5.30 |
4.83 |
3.32 |
0.46 |
|
December 2023 |
3.53 |
3.74 |
3.55 |
2.69 |
0.44 |
|
January 2024 |
1.18 |
0.57 |
0.32 |
0.08 |
0.49 |
|
February 2024 |
3.44 |
2.38 |
1.69 |
0.40 |
0.46 |
|
March 2024 |
3.43 |
3.05 |
2.52 |
1.36 |
0.43 |
Year to 31 March |
16.22 |
12.67 |
10.68 |
6.66 |
5.63 |
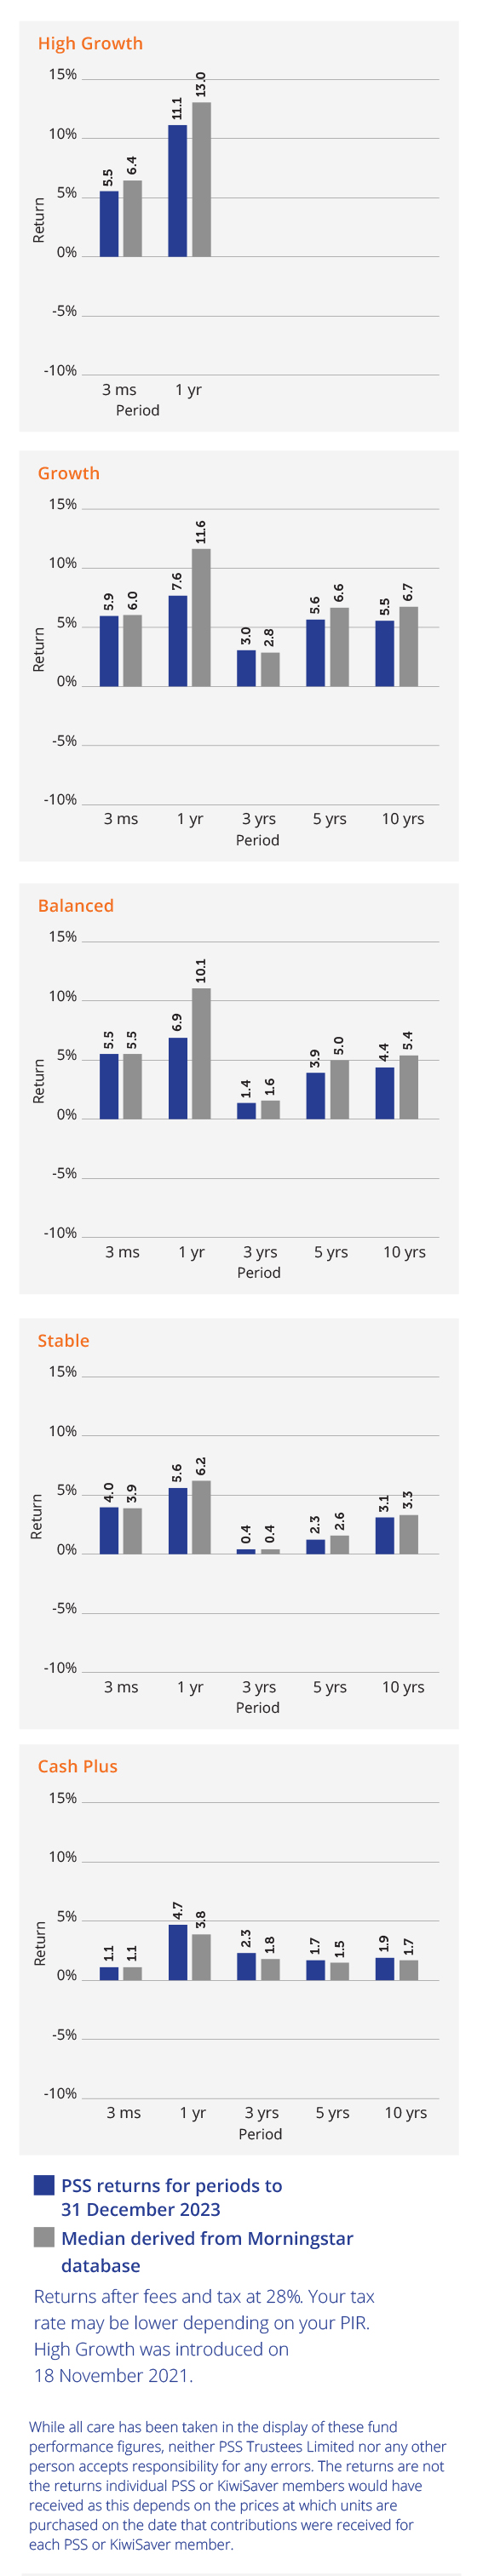
PSS vs KiwiSaver
Historical returns
Returns after fees and before tax. High Growth was introduced in November 2021. 2022 returns for High Growth are for the 5 months to 31 March 2022. Returns for 2020 are for the 9 months to 31 March 2020. Returns for 2015-2019 are for periods ended 30 June.
High Growth % |
Growth % |
Balanced % |
Stable % |
Cash Plus % |
|
|
2024 |
16.22 |
12.67 |
10.68 |
6.66 |
5.63 |
|
2023 |
-1.18 |
-4.26 |
-3.95 |
-1.66 |
3.25 |
|
2022 |
-5.92 (5 months) |
5.88 |
2.51 |
-0.72 |
0.53 |
|
2021 |
28.70 |
19.05 |
10.82 |
0.44 |
|
|
2020 (9 months) |
-10.52 |
-6.66 |
-2.81 |
1.21 |
|
|
2019 |
5.50 |
6.47 |
5.01 |
2.22 |
|
|
2018 |
7.10 |
5.42 |
4.15 |
2.22 |
|
|
2017 |
11.71 |
8.26 |
4.62 |
2.30 |
|
|
2016 |
4.25 |
5.75 |
6.21 |
2.86 |
|
|
2015 |
5.33 |
5.80 |
4.98 |
3.82 |
Performance against benchmark
Each option aims to outperform its benchmark. You can read more about benchmarks in the statement of investment policy and objectives. This table shows excess returns for periods to 31 December 2023 (before fees and tax).
Cash Plus |
Stable |
Balanced |
Growth |
High Growth |
|
|
1 month (%) |
-0.0 |
+0.1 |
+0.2 |
+0.2 |
+0.1 |
|
3 months (%) |
+0.0 |
+0.2 |
+0.2 |
+0.0 |
-0.3 |
|
1 year (%) |
+0.2 |
+0.1 |
-0.6 |
-1.1 |
-2.3 |
|
3 years (% p.a.) |
+0.2 |
+0.1 |
+0.1 |
+0.0 |
- |
|
5 years (% p.a.) |
+0.2 |
+0.4 |
+0.2 |
+0.0 |
- |
|
10 years (% p.a.) |
+0.3 |
+0.4 |
+0.4 |
+0.4 |
- |